When stocks lie: why stock market performance isn't economic performance

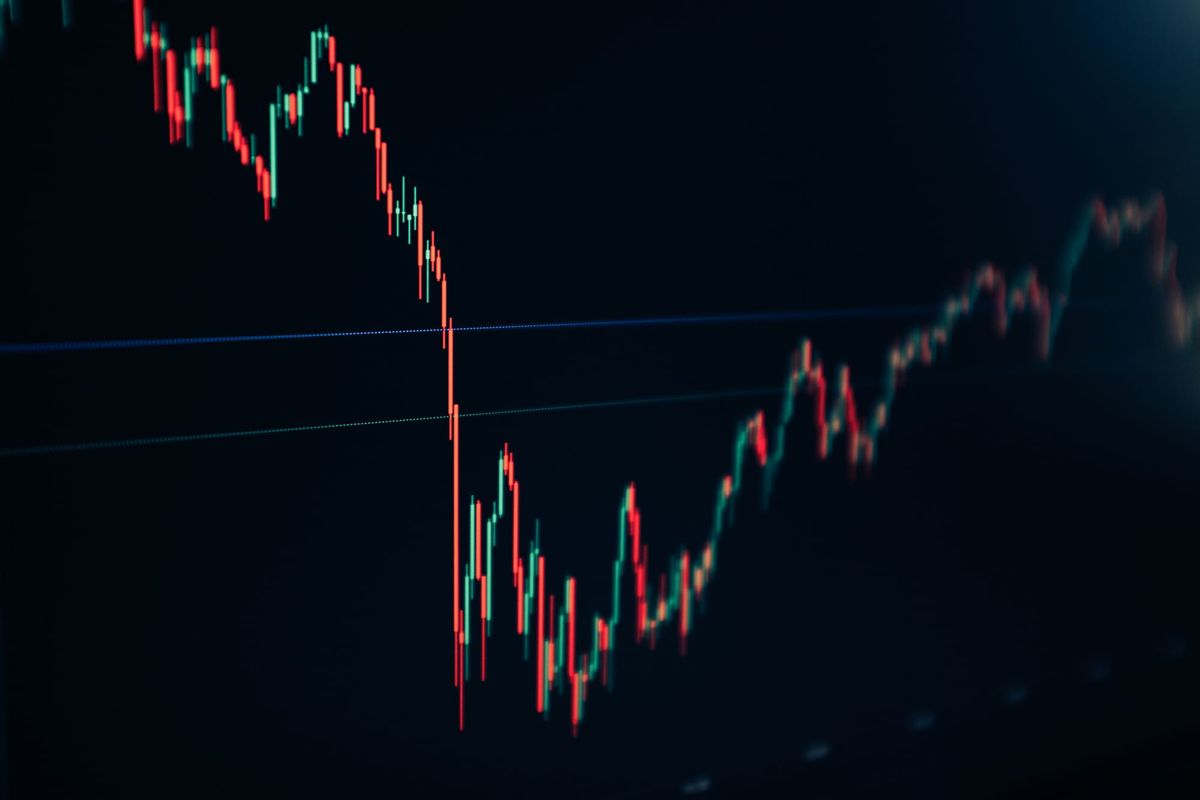
The largest single-day percentage drop in the Dow Jones Industrial Average was not due to one particular historical event.
It did not follow the announcement of either World War, the 1929 Wall Street Crash, or the bombing of Pearl Harbour in 1941. Nor did it occur at the trough of the market’s response to the Covid-19 pandemic, or in the midst of the Russia-Ukraine conflict. All of these are plausible takers, given their significant future effects on economic activity and stability. Instead, on Monday 19 October 1987, the Dow fell by over 22%. Known as Black Monday, the crash was striking not only for its scale but because it could not be explained by a single corresponding shock to economic activity, with no major news other than its own occurrence. Rather than a war, political assassination or pandemic, the market had merely amplified existing volatility to an extraordinary degree.
Clearly, it would have been inappropriate for this stark, economically disproportionate, stock market movement to be used as a reliable indicator of economic performance. The same applies to the Dot-com bubble’s burst in 2000, which was preceded by high stock market returns in the late 1990s, unbeknownst to the upcoming recession at the start of the next millenium.
However, the suitability of an indicator should not be judged merely by its anomalies, which risks overlooking valuable information it may contain. The argument that stock markets reflect the wider economy has foundation; share prices represent investors’ valuation of expected future cash flows discounted back to the present, after all. And if investors expect stronger economic growth, manifested through higher corporate revenue or profits, and higher future dividends or cash flows as a result, higher share prices would logically follow. The question, therefore, is not whether stock markets contain information about growth - their core purpose is predicting it - but how far movements in them can legitimately be interpreted as a reflection of the economy as a whole.
Alongside the core role of share prices being to predict growth, there are channels through which bullish stock markets can directly instigate economic growth too, correlating the two variables by not only reflecting expectations about future growth, but directly influencing it. One mechanism is the wealth effect, with higher portfolio values making people feel richer and, according to Ando and Modigliani’s (1963) life-cycle hypothesis, results in higher spending, which boosts demand for goods and services and encourages businesses to invest and expand, contributing to economic growth.
However, this mechanism is not linear among all households. The top 1% of equity holders account for approximately half of household corporate stock holdings in the US (Poterba, 2000), suggesting that even substantial blanket increases in asset values may result in only modest effects on the behaviour of the vast majority of households. Pearce (1983) finds that the size of the wealth effect itself depends on this distribution, with high-net worth individuals often having a lower propensity to consume wealth gains. Arguably, unequal distribution also makes the stock market a weaker indicator of growth, provided performance is measured by broadly shared gains rather than aggregate output.
A second theoretical channel through which stock market changes can directly affect growth is through the cost of equity. A high stock price relative to earnings means investors accept a lower yield, making equity financing cheaper and less dilutive. Companies are then able to use these funds for expansion; building new factories, hiring new workers and increasing R&D investment, for example. However, again, the practice of this theory is not always clear, with Morck et al. (1990) finding that real investment did not appear to rise sharply during the late 1920s boom, nor during the collapse following the aforementioned 1987 crash.
Share prices may also influence investment through secondary channels, such as perceived credit-worthiness when share prices are higher, enabling better loan conditions and lower debt costs (Croux & Reusens, 2013), as well as affecting managerial incentives, as managers whose remuneration, reputation or job security depend partly on share performance may become more responsive to investor expectations, potentially discouraging investments when markets signal pessimism about future profitability, for example.
However, the stock market’s role as both a forward-looking indicator and predictor of growth through causative channels is ultimately imperfect. Economic growth and stock market changes diverge in what they truly measure, capturing fundamentally different concepts, with the breadth of economic growth being significantly broader. Stock market indicators, such as the S&P 500 or FTSE indices, represent a limited scope of publicly traded firms, whose gains are often not representative of the economy as a whole. Government activity, for example, is not accounted for in these metrics, nor are private firms, household production, or not-for-profit activity. These, alongside publicly listed companies, also produce output and create jobs, while the stock market represents a small slice of overall activity, and therefore can not be truly representative of it.
The increasing concentration of a small number of large technology firms in major indices adds further complication. A rise in the value of a handful of highly capitalised firms can exert a substantial influence on an index despite representing only one part of the productive economy. In mid-2025, the 10 largest companies in the S&P 500, for example, represented almost 40% of the index (Edwards, 2026). Globalisation and the existence of multinational firms create another layer of complexity as the share price of domestic firms becomes more dependent on foreign sales and the foreign economy (Binswanger, 2004). A company listed in the UK can generate substantial revenues abroad; therefore, index performance is not necessarily an accurate indicator of overall UK economic performance.
However, arguably the comparison of forward-looking stock market changes with backward looking growth metrics, such as GDP, is unfair, with the measures intrinsically incompatible with each other. Stock prices by nature incorporate expectations about the future, and thus their divergence from current GDP does not automatically demonstrate market failure. A fairer test would therefore be to compare stock-market performance with subsequent, lagged GDP growth. Croux and Reusens (2013) find, using quarterly data for the G7 countries between 1991 and 2010, that stock prices do in fact have predictive power for future GDP, but importantly, only for the slowly fluctuating components of stock prices, and not during speculative periods. This suggests that while stock markets are not inherently poor predictors of growth, short-term volatility and speculative periods distort information.
Crucially, however, this reasoning depends on the accuracy of investor pricing, and in turn investor rationality. The sheer volatility in share price, as evidenced by the 1987 crash and seemingly random everyday changes to the casual viewer, beg the question of whether share prices are moving beyond what is justified by fluctuations in firm fundamentals. Shiller’s (1981) seminal variance-bound analysis found that aggregate stock prices fluctuated considerably more than could be justified by subsequent dividend changes, suggesting other factors could be affecting prices beyond traditional economic theory. De Bondt and Thaler (1985) explores a potential explanation for this, finding evidence that in violation to Bayes’ rule, investors overreact to unexpected and dramatic news events, with firms that were prior “losers” on the stock market subsequently outperforming prior “winners” by 25%, indicating that investors are overreacting to past performance.
Yet evidence of irrationality does not mean such mispricing should persist. Efficient Market Hypothesis offers an important contradiction: if deviations from fundamental value are predictable, surely rational investors should exploit them and drive prices back towards their underlying value. However, exploiting a deviation is not risk-free, and there are limits to arbitrage (Shleifer & Vishny, 1997). Underpriced assets may continue to fall before they recover, meaning that investors attempting to correct a mispricing can experience losses in the short term. This allows deviations from fundamental value to persist, even where some investors recognise them.
Overall, while the stock market in theory represents a useful predictor of economic growth through intrinsic purpose and causation, and empirical data suggests a relationship, its utility is contingent on what is meant by growth. Uneven gains, as seen currently with AI and technology firms holding a substantial share of recent market growth, mean that the stock market falls short as a representative measure of prosperity for the majority. More fundamentally, the stock market leaves out key components of domestic economic activity, while globalisation complicates the relationship between where firms are listed and where activity occurs. And the argument that the stock market is a good predictor of growth because that, in essence, is its job assumes it is good at its job: that investors are collectively rational and accurate in forecasting, and that share prices represent rational assessments of future cash flows.
Black Monday was not evidence that the stock market tells us nothing about the economy. But it was a reminder of the danger of assuming that every movement is an accurate representation of where it is heading. The stock market is not the economy, at best, it reflects semi-accurate expectations of future economic performance, but certainly not economic performance itself.
By Dia Abdul-Rahim
Bibliography
Ando, A., & Modigliani, F. (1963). The “life cycle” hypothesis of saving: Aggregate implications and tests. The American Economic Review, 53(1), 55–84. https://www.jstor.org/stable/1817129
Aylward, A., & Glen, J. (2000). Some international evidence on stock prices as leading indicators of economic activity. Applied Financial Economics, 10(1), 1–14. https://doi.org/10.1080/096031000331879
BARBERIS, N., JIN, L. J., & WANG, B. (2021). Prospect theory and stock market anomalies. The Journal of Finance, 76(5), 2639–2687. https://doi.org/10.1111/jofi.13061
Binswanger, M. (2004). How important are fundamentals?—Evidence from a structural VAR model for the stock markets in the US, Japan and Europe. Journal of International Financial Markets, Institutions and Money, 14(2), 185–201. https://doi.org/10.1016/j.intfin.2003.06.001
Case, K. E., Quigley, J. M., & Shiller, R. J. (2005). Comparing wealth effects: The stock market versus the housing market. Advances in Macroeconomics, 5(1). https://doi.org/10.2202/1534-6013.1235
Croux, C., & Reusens, P. (2013). Do stock prices contain predictive power for the future economic activity? A Granger causality analysis in the frequency domain. Journal of Macroeconomics, 35, 93–103. https://doi.org/10.1016/j.jmacro.2012.10.001
De BONDT, W. F. M., & THALER, R. (1985). Does the stock market overreact? The Journal of Finance, 40(3), 793–805. https://doi.org/10.1111/j.1540-6261.1985.tb05004.x
Demir, I. (2025). THE ROLE OF STOCK MARKETS IN ECONOMIC GROWTH Empirical evidence from panel data analysis . WFE Research Working Papers, (7).
Edwards, T. (2026). In the shadows of giants | S&P Global. S&P Global. https://www.spglobal.com/en/research-insights/special-reports/look-forward/partner-perspectives/unlocking-potential-ahead-with-vanguard/in-the-shadows-of-giants
Fichtner, F., & Joebges, H. (2024). Stock market returns and GDP growth. Handle.Net. https://doi.org/http://hdl.handle.net/10419/283065
Kevin Mahn. (2024, April 15). Stock market reactions to war and terrorist attacks. Hennion & Walsh. https://www.hennionandwalsh.com/insights/stock-market-reactions-to-war-and-terrorist-attacks-a-historical-analysis/
Modugno, M., & Palazzo, B. (2025). Decoding equity market reactions to Macroeconomic News. Finance and Economics Discussion Series, (2025–007), 1–1. https://doi.org/10.17016/feds.2025.007
Morck, R., Shleifer, A., Vishny, R. W., Shapiro, M., & Poterba, J. M. (1990). The stock market and investment: Is the market a sideshow? Brookings Papers on Economic Activity, 1990(2), 157. https://doi.org/10.2307/2534506
Morgan, J. P. (2024). How tech became everything to everyone | J.P. Morgan. J.P. Morgan. Jpmorgan.Com. https://www.jpmorgan.com/insights/markets-and-economy/top-market-takeaways/tmt-how-tech-became-everything-to-everyone
MSCI Barra. (2010). Is there a link between GDP growth and equity returns? |. https://www.msci.com/documents/10199/a134c5d5-dca0-420d-875d-06adb948f578
Pearce, D. (1983). Stock Prices and the Economy. Federal Reserve Bank of Kansas City, 7–22.
Poterba, J. M. (2000). Stock Market Wealth and Consumption. Journal of Economic Perspectives, 14(2), 99–118. https://doi.org/10.1257/jep.14.2.99
Shiller, R. J. (1981). Do stock prices move too much to be justified by subsequent changes in dividends? The American Economic Review, 71(3), 421–436. https://www.jstor.org/stable/1802789
Shleifer, A., & Vishny, R. W. (1997). The limits of arbitrage. The Journal of Finance, 52(1), 35–55. https://doi.org/10.2307/2329555
Trading Economics. (2019). Dow jones industrial average | 2019 | data | chart | calendar | forecast. Tradingeconomics.Com. https://tradingeconomics.com/united-states/stock-market
U.S. Bank. (2024, December 11). Stock Market under the Trump administration | U.S. Bank. Usbank.Com. https://www.usbank.com/investing/financial-perspectives/market-news/stock-market-under-trump.html
Wikipedia Contributors. (2019, February 4). Black monday (1987). Wikimedia Foundation. Wikipedia. https://en.wikipedia.org/wiki/Black_Monday_(1987)
Wilson, N. (2026, June 30). Half-year report: How markets have fared in the first half of 2026 and in Q2. Saxo. Saxobank. https://www.home.saxo/en-gb/content/articles/equities/half-year-report-30062026
World Bank. (2024). GDP growth (annual %) - United States. Worldbank.Org. https://data.worldbank.org/indicator/NY.GDP.MKTP.KD.ZG?locations=US