Put a Price on Emotion: Can Wellbeing Be Quantified?
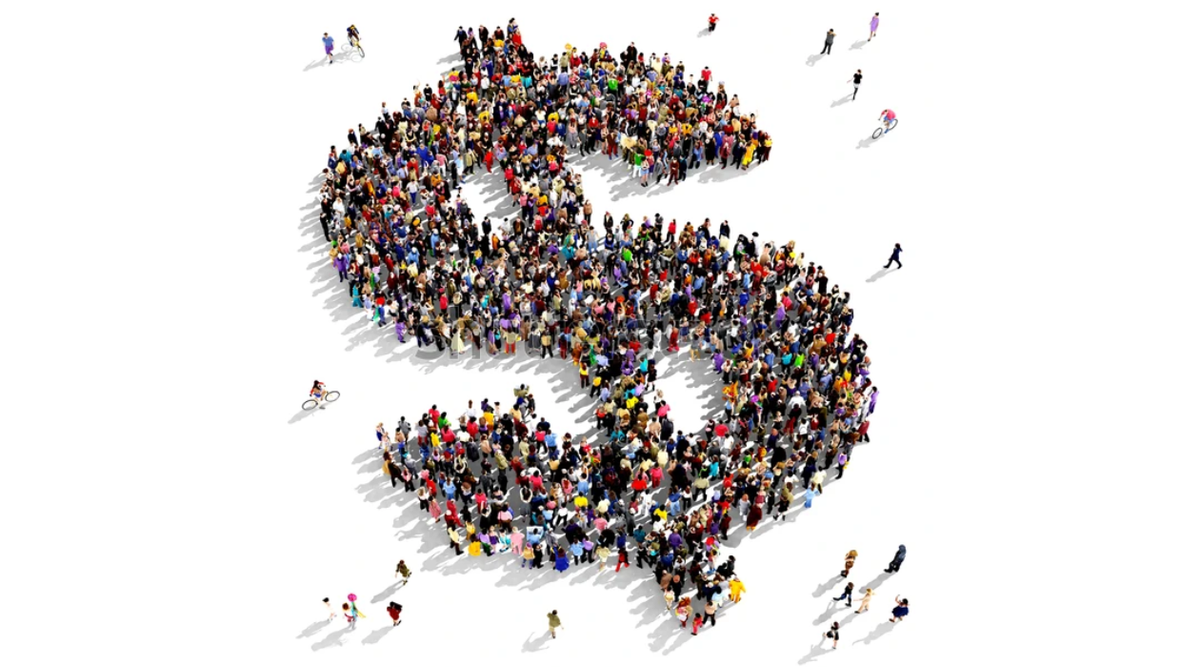
“Put a price on emotion.” Harry Styles’ Fine Line lyric poses, perhaps unintentionally, a question that both economists and governments have spent decades trying to answer: can human wellbeing be reduced to a number?
Too often the modern-day meaning of wealth is substituted for money, but empirical data suggests that this is conflation rather than a true proxy: in 1957, around 52% of Britons described themselves as “very happy”, but by the mid‑2000s, that figure had fallen to approximately 36%, despite incomes more than doubling over the same period (Jackson, 2006).
This divergence exposes an ambiguity in what it means to be “wealthy”. The Cambridge Dictionary (n.d.) gives the word two competing definitions. The first describes it as “a large amount of money or valuable possessions that someone has”, implying that wealth is determined primarily by economic output. Under this definition, GDP, which measures the total value of goods and services produced within an economy, may serve as a proxy for national prosperity. The second definition, however, describes wealth as “a large amount of something good”. This interpretation aligns more closely with the etymology of the word “wealth”, derived from the Old English weal, meaning “in a state of good fortune, welfare, or happiness” (Harper, n.d.).
If wealth is understood as wellbeing under this definition, then GDP is an insufficient measure. A country is only truly wealthy when economic output is sustainably translated into a high quality of life. Therefore, this article argues that GDP should be considered alongside broader indicators, such as the Social Progress Index, the World Happiness Report, and the OECD Better Life Index, to provide a more accurate picture of a country’s welfare.
Yet, the traditional argument for using GDP as a measure of wellbeing cannot be dismissed. A higher GDP often correlates with higher disposable incomes, allowing consumers to access more goods and services, thereby improving their standard of living. For example, the Social Progress Index found a strong positive relationship between GDP per capita and broader measures of social welfare (Social Progress Imperative, 2026). Where governments are efficient, higher GDP also expands fiscal capacity, enabling greater investment in healthcare, education, and infrastructure. Since 1990, rapid economic growth in China has contributed to lifting over 940 million people out of extreme poverty (World Bank, n.d.-a). For these individuals, GDP growth provided a lifeline out of poverty. Adam Smith captured this principle in The Wealth of Nations (1776), arguing that “no society can surely be flourishing and happy, of which the far greater part of the members are poor and miserable”, suggesting that a lack of poverty is a prerequisite for wellbeing. Today, absolute poverty is defined by the World Bank as living on less than the 2021 equivalent of 3 USD per day (World Bank, n.d.-a); hence, this quote indicates that a certain GDP per capita is a necessary condition for prosperity; however, it is not sufficient.
Using GDP as a proxy for welfare rests on the assumption that human happiness can be reduced to a number in individuals’ bank accounts. The idiom “money can’t buy happiness” is rooted in economic truth: Tim Kasser (2002) found that, on average, people with materialistic values are less happy than others. This phenomenon is due to modern economies operating within an “iron cage of consumerism”, according to Tim Jackson (2009). Firms rely on ever‑increasing consumption to maintain profits, while consumers are motivated by competition for status and social comparison, meaning that consumption often only provides short‑term welfare. Therefore, GDP may rise even when wellbeing stagnates. The Easterlin Paradox (1974) reinforces this idea: although richer individuals tend to report higher happiness at any given moment, long-term increases in national income do not always produce equivalent increases in average happiness, possibly due to the law of diminishing marginal utility. Similarly, in developed countries, falling happiness can itself increase GDP: individuals may turn to “retail therapy” or devote more time to work at the expense of social engagement, raising output while reducing life satisfaction. Moreover, GDP measures the total value of goods and services produced within an economy, including those that actively hinder wellbeing. Rising crime increases spending on security, and illness increases spending on medication; both raise GDP, yet neither makes society socially wealthier. Simon Kuznets (1934), one of the architects of GDP, warned that “the welfare of a nation can, therefore, scarcely be inferred from a measurement of national income”. GDP’s failure to account for factors influencing quality of life may reflect its historical origins: its modern form was largely reshaped by the need to measure how much production could be directed towards the Second World War (Vanham, 2021).
Clearly, a high GDP is not a sufficient condition for high welfare, but it may not be a necessary one either. Costa Rica is wealthy in the original sense of the word, but not the modern one. Despite having a GDP per capita of $18,587 (World Bank, n.d.-b), which is far lower than Western Europe’s $59,550 (International Monetary Fund, 2026), Costa Rica’s levels of social progress are comparable to significantly wealthier nations (Social Progress Imperative, 2026). This illustrates that the scale of economic output alone does not determine true wealth; rather, it is determined by how effectively output is converted into wellbeing.
GDP also fails to account for how income is distributed, since it measures the size of the economic pie rather than how it is divided. London illustrates this clearly: despite generating around £618 billion in economic output, almost 2.5 million Londoners, or 27%, live in poverty once housing costs are considered (Trust for London, 2026). London exemplifies that high economic output does not necessarily translate into household welfare: if housing costs absorb much of your income, you might live in a wealthy economy without experiencing wealth yourself. Since GDP conceals deprivation within the country’s most productive city, the disputed geography of England’s North-South divide begs the question: where does inequality begin, and which indicators should be trusted to draw its border?
The North-South divide refers broadly to the socio-economic gap between the North and South of England; however, its exact boundaries are widely disputed. In order to try and correct regional inequalities, the government must first understand which areas are most significantly impacted, and hence they focus on the socio-economic indicators that they believe best reflect welfare, such as GVA (regional gross value added), IMD, house prices, life expectancy, and education. GVA can simply be described as regional GDP, and although it may correlate with these other indicators, it can generate a convincing spatial pattern without validly measuring prosperity.
The difficulty is therefore not simply drawing the North-South divide, but deciding which observable patterns constitute valid evidence of welfare.
For example, Smith and Haverson (2023) plotted the store locations of Greggs and Pret stores in England, as shown in Figure 1, and used machine learning to draw a line which best separated the majority of the two. Although the authors do acknowledge that Cornwall was anomalously classified as Northern, this limitation may reflect Cornwall’s experience as one of the poorest parts of England. Similarly, the study is an unpublished preprint with a light-hearted tone, limiting its credibility. Overall, while this study was limited and the proxy’s validity is unproven, it may not necessarily be invalid, since these stores’ marketing and presentation target different consumer groups, who are often associated with varying income classes.
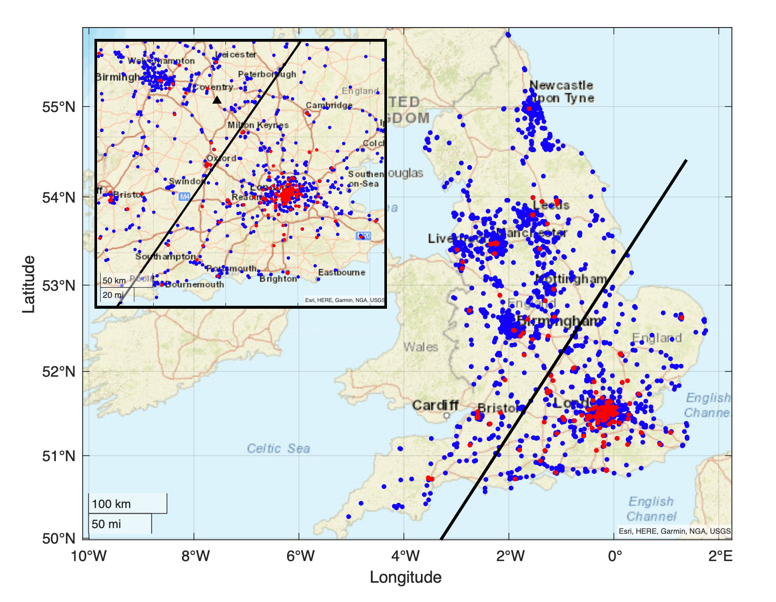
Figure 1: North-South divide as determined by the Greggs and Pret shops analysed using machine learning models(Source: Smith and Haverson, 2023)
However, other unorthodox measures have been used. Most interesting are dialect and linguistic measures, including the varying percentages of individuals saying “tea” and “dinner”, along with mapping the divide between the so-called “trap-bath split”, which effectively maps the proportion of the population saying long versus short ‘a’ sounds in the word “bath”. YouGov’s 51,000-person survey (2025), shown in Figure 2, found a distinct concentration of the long ‘a’ sound in southern England, while YouGov and Kiwi Movers found markedly different results in terms of the “dinner” and “tea” mapping.
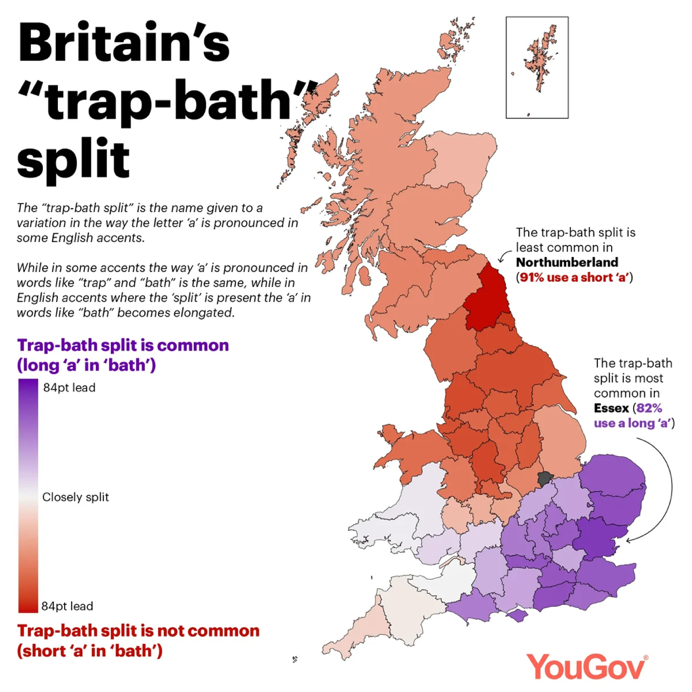
Figure 2: North-South divide as determined by the “trap-bath” split (Source: Smith, 2025)
Kiwi Movers (2017) polled 3,000 UK adults, producing the map shown in Figure 3, in which economic hubs contain pockets of “dinner”-speaking places, such as Manchester and York, bearing an uncanny resemblance to the ONS map of household income (2023) in Figure 4. This reflects a historical distinction: as work became more office-based, the one midday “dinner” meal was pushed later by wealthier classes, while the working class continued to call their evening meal “tea” and kept their “dinner” at midday (Orwell, 1946). Therefore, variations in whether people say “tea” or “dinner” may reveal geographical differences in income, occupational sector and access to high-paying employment. On the other hand, the 2018 YouGov poll, which mapped the same linguistic divide shown in Figure 5 but with a much larger sample of over 42,000 English adults, did not reproduce these pockets (Smith, 2018). Although there may be some method behind the madness, the resemblance of both the “tea”/”dinner” and the long/short ‘a’ maps to the ONS map may be a spurious correlation rather than evidence that language is a valid proxy for welfare.
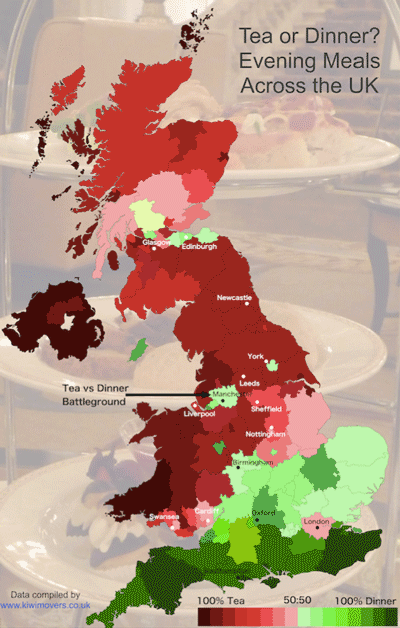
Figure 3: North-South divide as determined by whether individuals say “tea” or “dinner” (Source: Kiwi Movers, 2017)
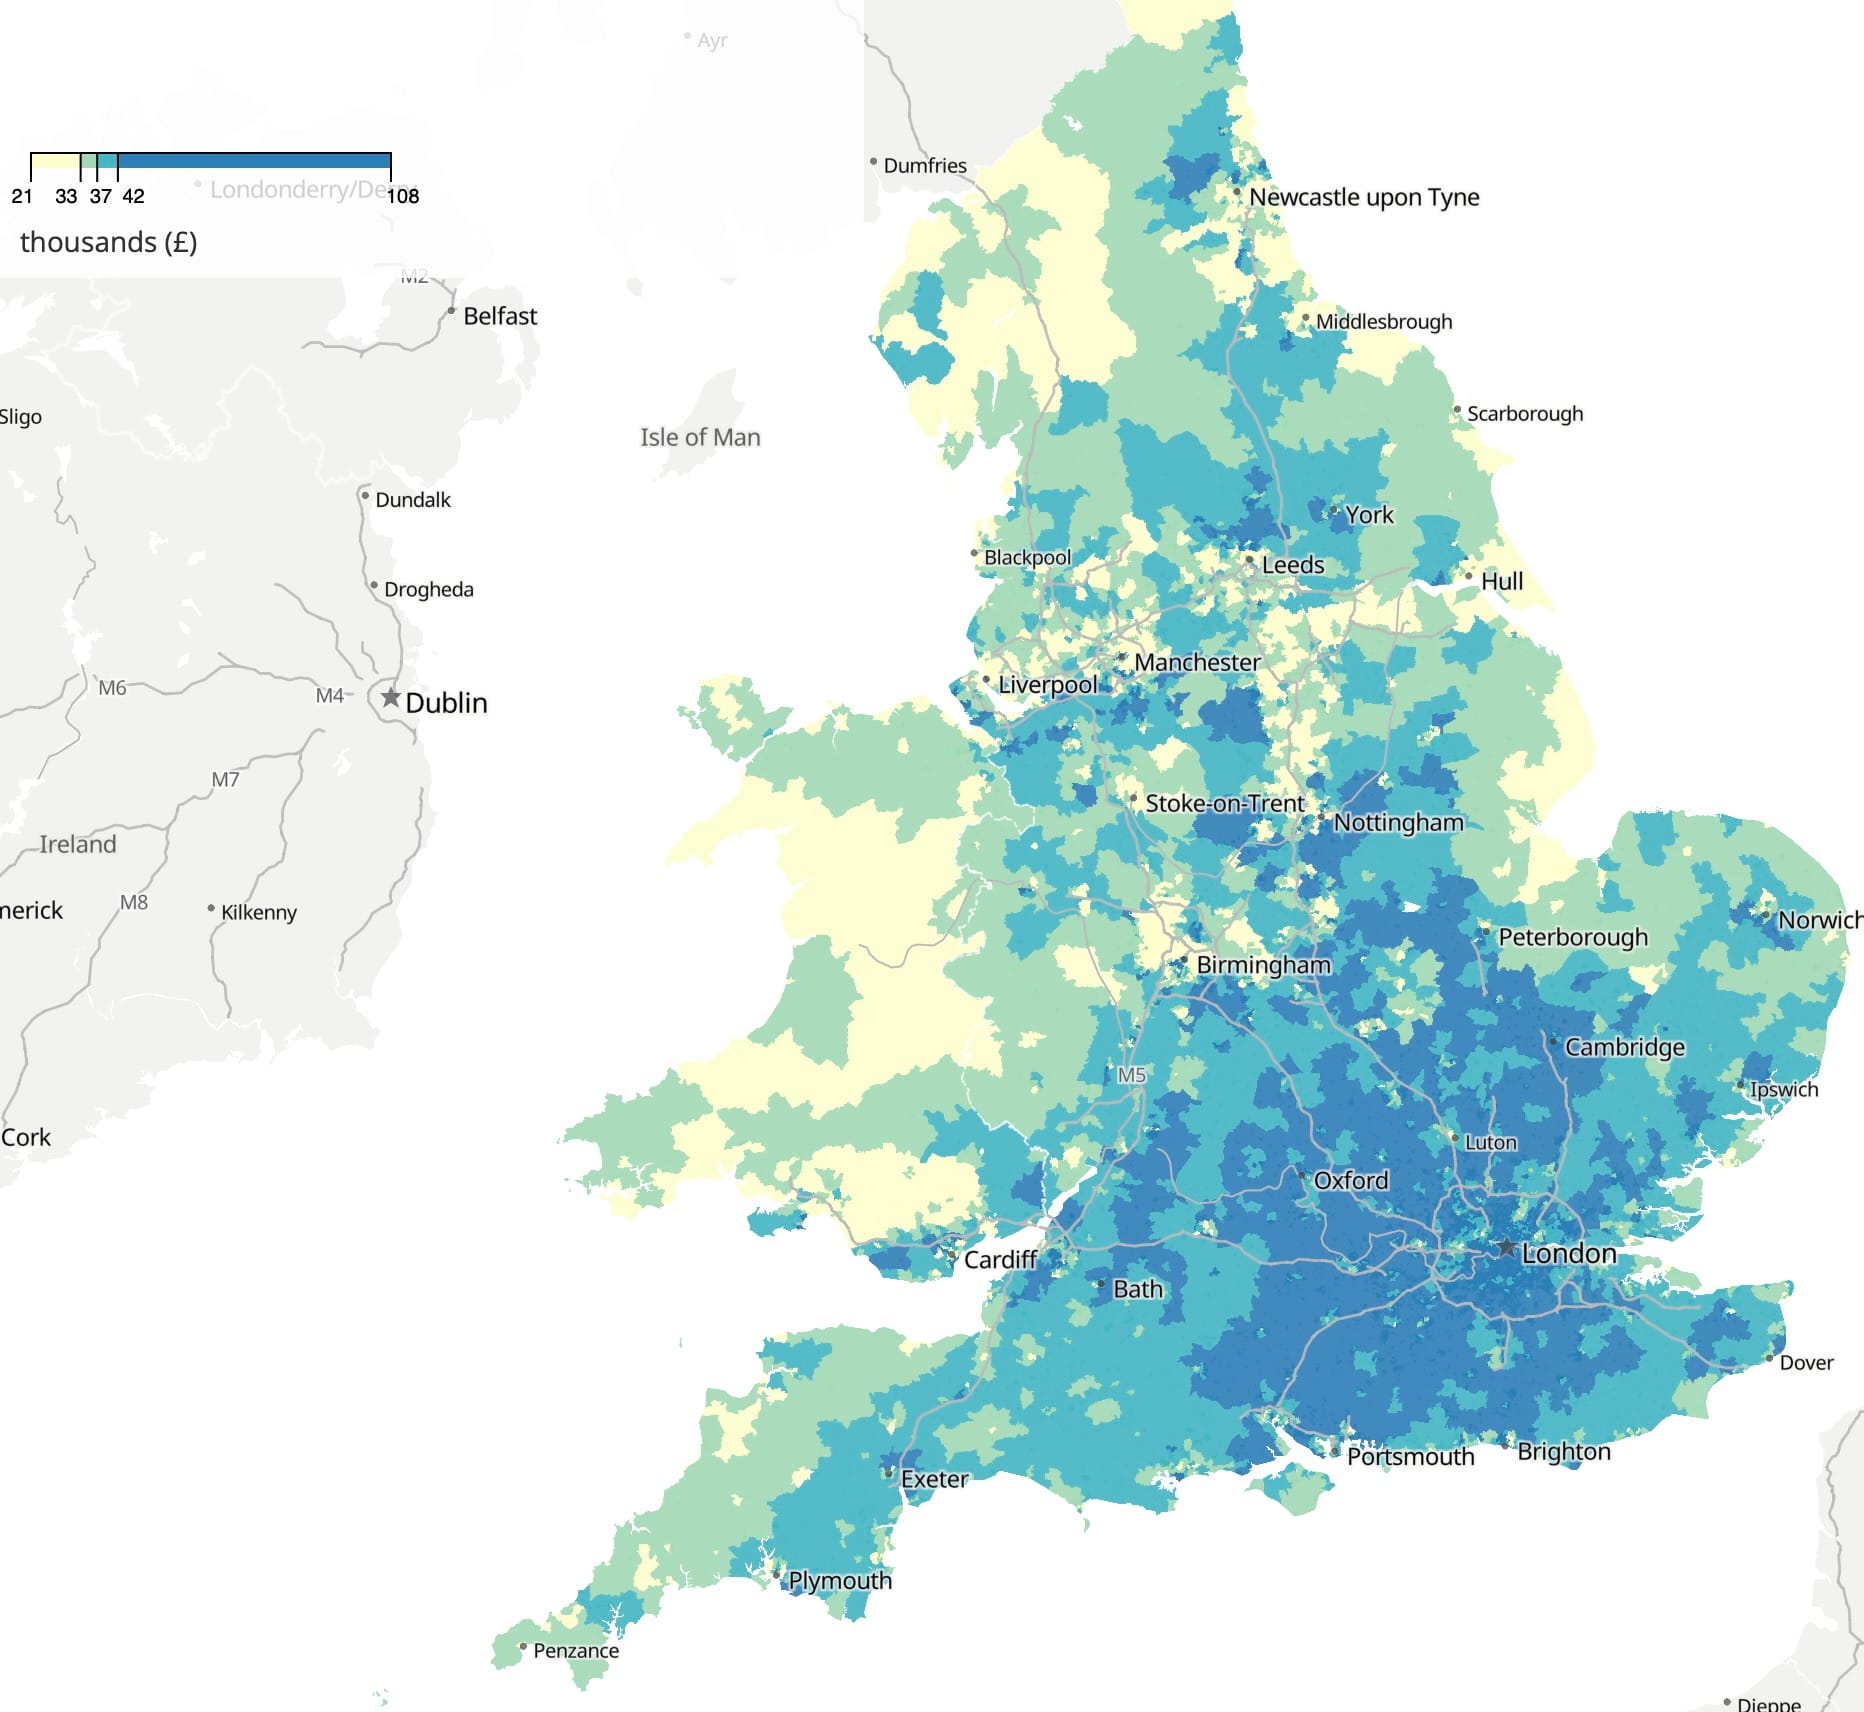
Figure 4: Mean disposable annual household income before housing costs for local areas in 2023 (Source: Office for National Statistics, 2025)
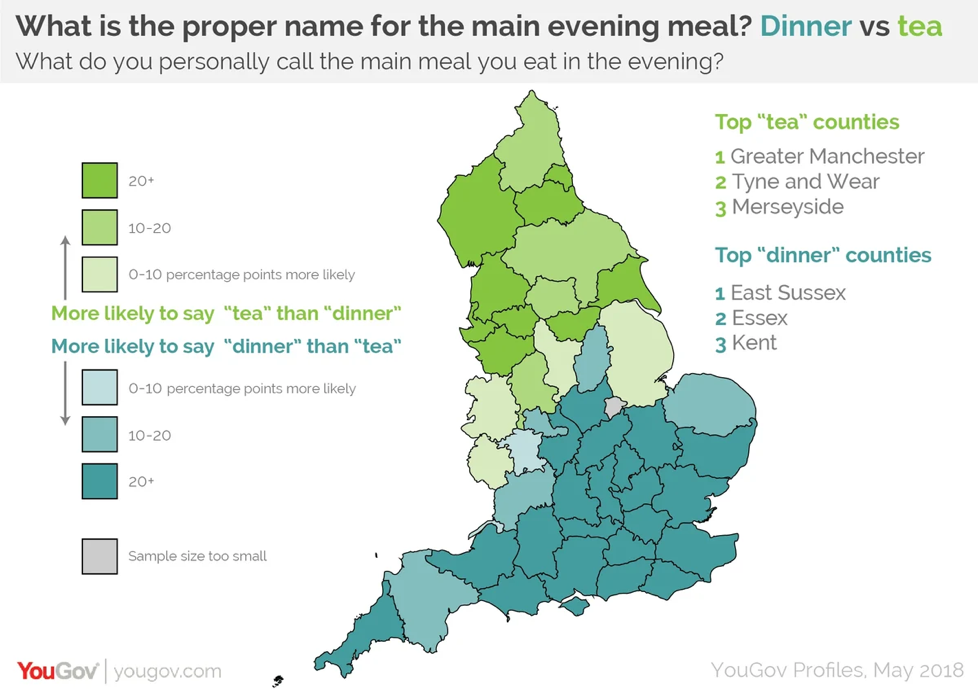
Figure 5: North-South divide as determined by whether individuals say “tea” or “dinner” (Source: Smith, 2018)
These maps expose the danger of mistaking a recognisable pattern for a valid measure of welfare. If shops and accents are merely correlated with socioeconomic conditions rather than wellbeing itself, indicators such as GVA cannot automatically be assumed valid simply because they reproduce a familiar geography of prosperity. Validity depends not on whether the resulting pattern looks plausible, but on whether the indicator captures what it claims to measure.
As a result, indicators that directly measure aspects of quality of life, such as the World Happiness Report and the OECD Better Life Index, have become widely used alongside GDP.
The World Happiness Report uses the Cantril Ladder, which asks respondents to place their current life on a scale from 0, representing the worst possible life, to 10, representing the best possible life (World Happiness Report, n.d.). One major weakness is that one metaphorical question is used to represent an extremely complex concept. The conception of the ‘worst’ and ‘best’ possible lives varies widely and is often subjective across cultures and individuals. Some respondents may also not view the distances between the scale points as equal, further impeding the accuracy of the data. On the other hand, it allows individuals to decide for themselves what constitutes an ideal life, meaning that researchers do not substitute their conceptions of quality of life for those of the respondents.
Wellbeing is inherently personal, so a single economic indicator will never truly capture it; human experiences are non-uniform, meaning that variation is not a flaw; it is the point. Hence, despite the surrounding controversy, it seems that the World Happiness Report is appropriate for measuring these varying experiences.
Yet allowing individuals to define a ‘good life’ for themselves solves only one problem. Whereas the World Happiness Report evaluates life as a whole, the OECD Better Life Index (OECD, 2026) and Eurostat’s 8+1 framework (Eurostat, n.d.) divide it into measurable dimensions using many quantitative factors such as material living conditions, health, education, economic security and physical safety, among many others. However, most of these indicators are interlinked, such as literacy rates and income, since more time spent in education increases the proportion of “knowledge-sector” jobs in the tertiary and quaternary sectors, which tend to be much higher-paid. Equally, higher incomes and GDP allow for greater government investment, improving healthcare (another indicator) and education, thereby raising literacy rates further.
Stiglitz, Sen, and Fitoussi’s 2009 report is particularly useful because it directly compares different ways of measuring quality of life rather than presenting a single measure as universally correct. It raises the issue that GDP alone is insufficient to measure welfare, since it overlooks tangible measures of wellbeing, inequality, unpaid work, and sustainability. Firstly, the subjective wellbeing approach relies on individuals’ evaluations of their own lives, arguing that enabling people to be happy with their lives is “a universal goal of human existence”. Secondly, there is the capability approach. This considers a person’s life as a combination of various “doings and beings” and the freedom they have to choose between them. Therefore, it not only measures people’s achievements but also the full range of opportunities open to them, particularly people's ability “to pursue and realise the goals that he or she values.” Finally, the fair-allocation approach combines several quality-of-life indicators to “weigh the various non-monetary dimensions of quality of life … in a way that respects people’s preferences.” Methodologically, the report notes that it is important not to ask individuals how much they would be willing to spend to achieve this non-monetary dimension, since it could “disproportionately reflect the preferences of those who are better-off in society.” It seems that Harry Styles has not read this report, since in his song Fine Line, he says, “put a price on emotion, I’m looking for something to buy.”
Taken together, this literature demonstrates that quality of life cannot be adequately represented by either economic indicators or self-reported satisfaction alone. Although a country with a high GDP can certainly be considered economically wealthy, it is not truly wealthy unless that output translates into tangible improvements in wellbeing that can be sustained over time. In summary, GDP is a valuable means, but it is not an end. Therefore, welfare is best quantified by triangulating economic, objective and subjective indicators, rather than relying on any single proxy or composite index.
By Leona Bastianic
Bibliography
Cambridge Dictionary (n.d.) ‘Wealth’. Cambridge Dictionary. Available at: https://dictionary.cambridge.org/dictionary/english/wealth (Accessed: 29 May 2026).
Easterlin, R.A. (1974) ‘Does economic growth improve the human lot? Some empirical evidence’, in David, P.A. and Reder, M.W. (eds.) Nations and Households in Economic Growth: Essays in Honour of Moses Abramovitz. New York: Academic Press, pp. 89-125. Available at: https://www.sciencedirect.com/science/chapter/edited-volume/abs/pii/B9780122050503500087 (Accessed: 23 June 2026).
Eurostat (n.d.) ‘Quality of life: overview’. Available at: https://ec.europa.eu/eurostat/web/quality-of-life (Accessed: 17 August 2026).
Harper, D. (n.d.) ‘Wealth’. Online Etymology Dictionary. Available at: https://www.etymonline.com/word/wealth(Accessed: 27 June 2026).
House of Commons Library (2025) London’s contribution to the national economy. London: UK Parliament. Available at: https://commonslibrary.parliament.uk/research-briefings/cdp-2025-0153/ (Accessed: 5 May 2026).
International Monetary Fund (2026) ‘World Economic Outlook Database’. IMF DataMapper. Available at: https://www.imf.org/external/datamapper/profile/WEQ (Accessed: 23 June 2026).
Jackson, T. (2006) Beyond the “Wellbeing Paradox”: Wellbeing, Consumption Growth and Sustainability. Guildford: University of Surrey. Available at: https://www.surrey.ac.uk/sites/default/files/2021-06/beyond-the-wellbeing-paradox.pdf (Accessed: 15 June 2026).
Jackson, T. (2009) Prosperity without Growth: Economics for a Finite Planet. London: Routledge.
Kasser, T. (2002) The High Price of Materialism. Cambridge, MA: MIT Press. Available at: https://doi.org/10.7551/mitpress/3501.001.0001 (Accessed: 27 June 2026).
Kiwi Movers (2017) ‘Dinner, tea or supper? Data analysis solves the debate on what the UK’s evening meal is called’, 8 March. Available at: https://kiwimovers.co.uk/news/dinner-tea-or-supper-data-analysis-solves-the-debate-on-what-the-uks-evening-meal-is-called/ (Accessed: 17 August 2026).
Kuznets, S. (1934) National Income, 1929–1932. Washington, DC: US Government Printing Office. Available at: https://fraser.stlouisfed.org/title/national-income-1929-1932-971 (Accessed: 27 June 2026).
OECD (2026) ‘Better Life Index’. OECD Well-being Data Monitor. Available at: https://www.oecd.org/en/data/tools/well-being-data-monitor/better-life-index.html (Accessed: 27 June 2026).
Office for National Statistics (2025) Income estimates for small areas, England and Wales: financial year ending 2023. Statistical bulletin, 10 December. Available at: https://www.ons.gov.uk/peoplepopulationandcommunity/personalandhouseholdfinances/incomeandwealth/bulletins/smallareamodelbasedincomeestimates/financialyearending2023(Accessed: 17 August 2026).
Orwell, G. (1946) ‘British Cookery’. British Council, April. Available at: https://www.britishcouncil.org/research-policy-insight/insight-articles/defence-english-cooking (Accessed: 17 August 2026).
Smith, A. (1776) An Inquiry into the Nature and Causes of the Wealth of Nations. London: W. Strahan and T. Cadell.
Smith, M. (2018) ‘Dinner time or tea time? It depends on where you live’. YouGov, 22 May. Available at: https://yougov.com/en-gb/articles/20826-dinner-time-or-tea-time-it-depends-where-you-live (Accessed: 17 August 2026).
Smith, M. (2025) ‘Do you use a long “a” or short “a”? Britain’s “trap-bath split” mapped’. YouGov, 23 January. Available at: https://yougov.com/en-gb/articles/51445-do-you-use-a-long-a-or-short-a-britains-trap-bath-split-mapped (Accessed: 17 August 2026).
Smith, R. and Haverson, K.C.Z. (2023) ‘The Greggs-Pret Index: A machine learning analysis of consumer habits as a metric for the socio-economic North-South divide in England’. Unpublished preprint. Sheffield Hallam University. Available at: https://shura.shu.ac.uk/31729/1/GreggsPretNorthSouth.pdf (Accessed: 17 August 2026).
Social Progress Imperative (2026) 2026 Global Social Progress Index. Available at: https://www.socialprogress.org/social-progress-index (Accessed: 27 June 2026).
Stiglitz, J.E., Sen, A. and Fitoussi, J.-P. (2009) Report by the Commission on the Measurement of Economic Performance and Social Progress. Paris: Commission on the Measurement of Economic Performance and Social Progress. Available at: https://ec.europa.eu/eurostat/documents/8131721/8131772/Stiglitz-Sen-Fitoussi-Commission-report.pdf (Accessed: 5 May 2026).
Trust for London (2026) ‘Poverty 2026: London has highest poverty rate in the country again’. Trust for London. Available at: https://trustforlondon.org.uk/news/poverty-2026-london-has-highest-poverty-rate-in-the-country-for-second-year-in-a-row/ (Accessed: 24 May 2026).
Vanham, P. (2021) ‘A brief history of GDP—and what could come next’. World Economic Forum, 13 December. Available at: https://www.weforum.org/stories/geo-economics-and-politics/stakeholder-capitalism-episode-1-a-brief-history-of-gdp/ (Accessed: 17 August 2026).
Williams, J. (2012) ‘An etymology of wealth’, The Earthbound Report, 14 March. Available at: https://earthbound.report/2012/03/14/an-etymology-of-wealth/ (Accessed: 23 June 2026).
World Bank (n.d.-a) ‘China country profile’. Poverty and Inequality Platform. Available at: https://pip.worldbank.org/country-profiles/CHN (Accessed: 17 August 2026).
World Bank (n.d.-b) ‘GDP per capita (current US$)’. World Bank Data. Available at:https://data.worldbank.org/indicator/NY.GDP.PCAP.CD?locations=CR (Accessed: 23 June 2026).
World Happiness Report (n.d.) ‘About’. World Happiness Report. Available at: https://www.worldhappiness.report/about/ (Accessed: 23 June 2026).